Free Access
Fig. 3
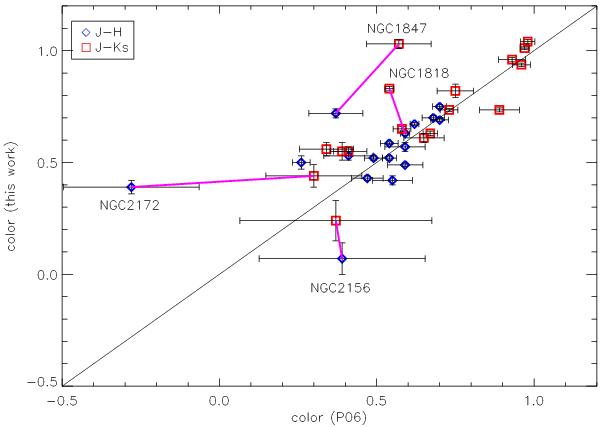
Comparison of our integrated NIR colours of MC clusters with those from P06. (J − H) and (J − Ks) colours are plotted as blue diamonds and red squares, respectively. The straight continuous line is a one-to-one relationship. Line segments connect colours of cluster outliers.
Current usage metrics show cumulative count of Article Views (full-text article views including HTML views, PDF and ePub downloads, according to the available data) and Abstracts Views on Vision4Press platform.
Data correspond to usage on the plateform after 2015. The current usage metrics is available 48-96 hours after online publication and is updated daily on week days.
Initial download of the metrics may take a while.