Free Access
Fig. 10
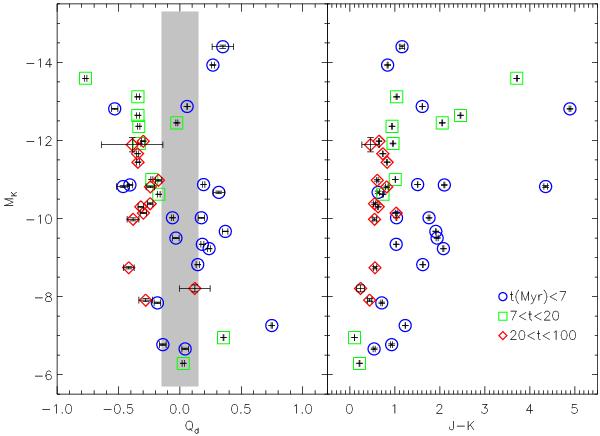
Left: absolute Ks band magnitudes versus the reddening-free index Qd for 42 clusters in the Local Group with ages up to 100 Myr; The grey bar indicates the range of Qd values corresponding to the transition between young and old clusters, according to Fig. 7. Right: colour−magnitude diagram for the same clusters.
Current usage metrics show cumulative count of Article Views (full-text article views including HTML views, PDF and ePub downloads, according to the available data) and Abstracts Views on Vision4Press platform.
Data correspond to usage on the plateform after 2015. The current usage metrics is available 48-96 hours after online publication and is updated daily on week days.
Initial download of the metrics may take a while.