Free Access
Fig. 4
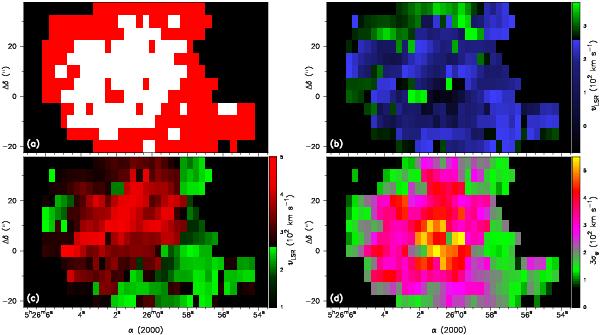
Radial velocity and velocity dispersion maps of N 49. Panels: a) mask for the adopted limits of N 49 (black for discarded pixels) and for the areas with double-peak (white) or single (red) lines; b) radial velocity of component 1 (blue); c) radial velocity of component 2 (red); d) 3σv velocity dispersion.
Current usage metrics show cumulative count of Article Views (full-text article views including HTML views, PDF and ePub downloads, according to the available data) and Abstracts Views on Vision4Press platform.
Data correspond to usage on the plateform after 2015. The current usage metrics is available 48-96 hours after online publication and is updated daily on week days.
Initial download of the metrics may take a while.