Fig. 2
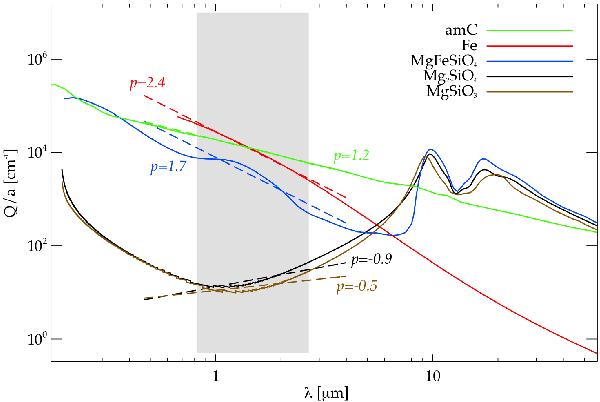
Efficiency per grain radius Qacc / agr in the small particle limit, as a function of wavelength, for a selection of dust species. The dashed lines show the power law fit corresponding to Eq. (8) and the shaded area indicates the wavelength region for which the optical data is fitted (for references to the sources of optical data see Table 3).
Current usage metrics show cumulative count of Article Views (full-text article views including HTML views, PDF and ePub downloads, according to the available data) and Abstracts Views on Vision4Press platform.
Data correspond to usage on the plateform after 2015. The current usage metrics is available 48-96 hours after online publication and is updated daily on week days.
Initial download of the metrics may take a while.