Fig. 9
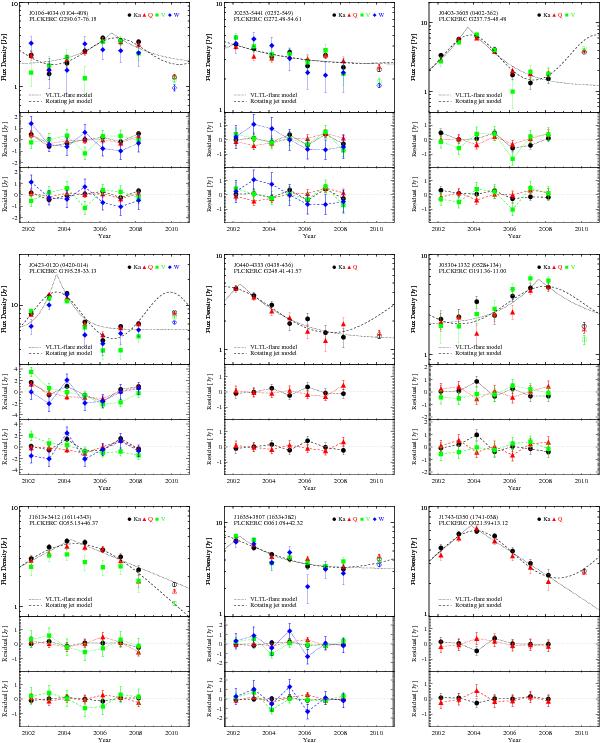
Top panels: WMAP/Planck light curves for the sources that are well fit by both the VLTL-flare model and the rotating jet model. The WMAP data are shown by filled symbols and the later Planck data are shown by open symbols. Middle panels: residuals between the normalised WMAP flux densities (Eq. (11)) and the VLTL-flare model. Bottom panels: residuals between the normalised WMAP flux densities and the rotating jet model. Grey dash dot lines indicate the zero level in the residual plots.
Current usage metrics show cumulative count of Article Views (full-text article views including HTML views, PDF and ePub downloads, according to the available data) and Abstracts Views on Vision4Press platform.
Data correspond to usage on the plateform after 2015. The current usage metrics is available 48-96 hours after online publication and is updated daily on week days.
Initial download of the metrics may take a while.