Fig. 5
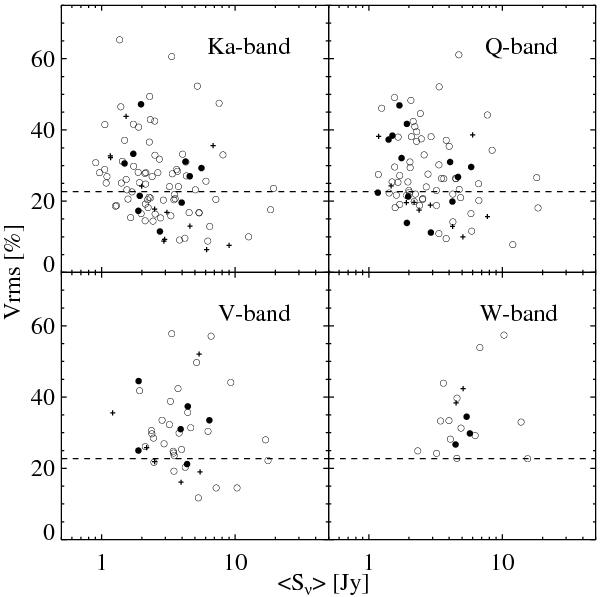
Dependence of fractional variability index Vrms on mean flux density ⟨ Sν ⟩ in Ka, Q, V, and W bands for variable sources. BLLs are shown by filled circles, FSRQs by open circles, and all the other sources by plus signs. The dashed lines indicate the level of  . The apparent trend of increasing variability with decreasing flux density is likely an artefact arising from the application of a significance cut in the presence of large measurement errors.
Current usage metrics show cumulative count of Article Views (full-text article views including HTML views, PDF and ePub downloads, according to the available data) and Abstracts Views on Vision4Press platform.
Data correspond to usage on the plateform after 2015. The current usage metrics is available 48-96 hours after online publication and is updated daily on week days.
Initial download of the metrics may take a while.