Fig. D.1
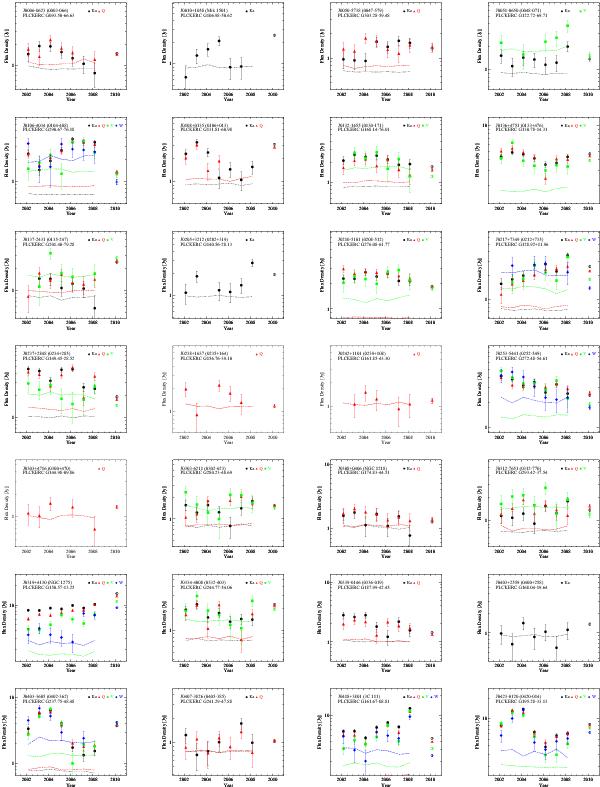
WMAP/Planck light curves for sources with at least one good timeline (i.e., four or more > 3σ data points in seven years of WMAP observation) in our sample. For each good timeline, all > 2σ data points are plotted, with dash-dot lines indicating the 3σ level. The WMAP flux densities are shown by filled symbols and the Planck flux densities are shown by open symbols of the same shape.
Current usage metrics show cumulative count of Article Views (full-text article views including HTML views, PDF and ePub downloads, according to the available data) and Abstracts Views on Vision4Press platform.
Data correspond to usage on the plateform after 2015. The current usage metrics is available 48-96 hours after online publication and is updated daily on week days.
Initial download of the metrics may take a while.