Free Access
Fig. 12
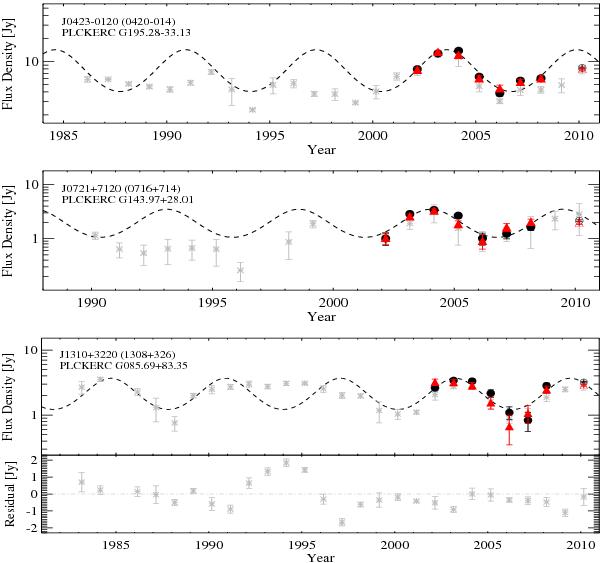
WMAP/Planck light curves for the sources J0423 − 0120, J0721+7120, and J1310+3220 at 33 GHz (black filled circles) and 41 GHz (red filled triangles), with the Metsähovi 37 GHz long-term monitoring data added (grey stars). For J1310+3220, the residuals between the Metsähovi data and the best fit model are shown.
This figure is made of several images, please see below:
Current usage metrics show cumulative count of Article Views (full-text article views including HTML views, PDF and ePub downloads, according to the available data) and Abstracts Views on Vision4Press platform.
Data correspond to usage on the plateform after 2015. The current usage metrics is available 48-96 hours after online publication and is updated daily on week days.
Initial download of the metrics may take a while.