Fig. 8
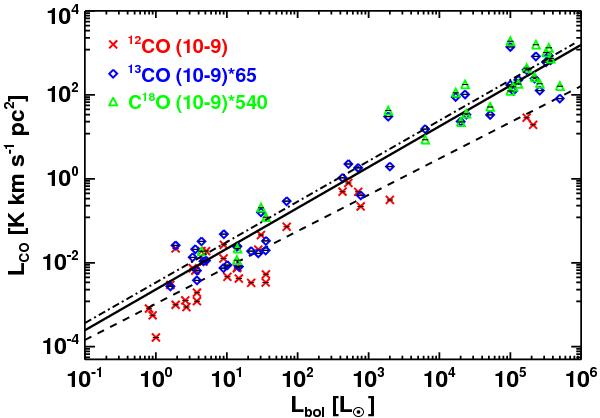
Line luminosity of the 12CO J = 10–9 emission lines, red crosses, versus their bolometric luminosity, together with the line luminosity of the 13CO J = 10–9 spectra, blue diamonds, multiplied by the assumed abundance ratio of 12C/13C for the entire WISH sample of YSOs. The line luminosity of the C18O J = 10–9 lines, green triangles, multiplied by the assumed abundance ratio of 16O/18O is plotted together with the previous values. The dashed line represents the linear fit of the 12CO J = 10–9 spectra, the full line that for the 13CO J = 10–9 transition and the dash-dot line indicates the fit for the C18O J = 10–9 data.
Current usage metrics show cumulative count of Article Views (full-text article views including HTML views, PDF and ePub downloads, according to the available data) and Abstracts Views on Vision4Press platform.
Data correspond to usage on the plateform after 2015. The current usage metrics is available 48-96 hours after online publication and is updated daily on week days.
Initial download of the metrics may take a while.