Fig. B.1
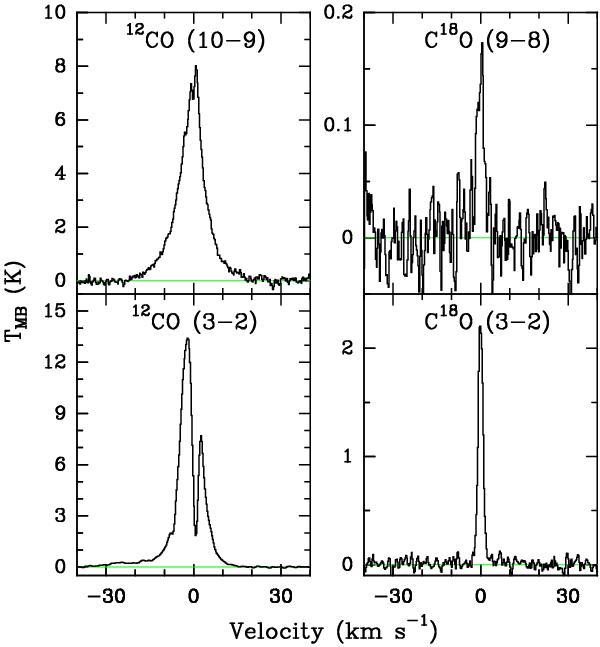
Comparison between high-J HIFI and low-J JCMT spectra for the low-mass source Ser SMM1. 12CO J = 10–9 spectra (left-top) and C18O J = 9–8 line (right-top) observed with HIFI and for the 12CO J = 3–2 and C18O J = 3–2 lines (left-bottom and right-bottom respectively) observed with JCMT. The spectra have been resampled to 0.27 km s-1 and shifted to zero velocity. The green line indicates the baseline subtraction.
Current usage metrics show cumulative count of Article Views (full-text article views including HTML views, PDF and ePub downloads, according to the available data) and Abstracts Views on Vision4Press platform.
Data correspond to usage on the plateform after 2015. The current usage metrics is available 48-96 hours after online publication and is updated daily on week days.
Initial download of the metrics may take a while.