Fig. 2
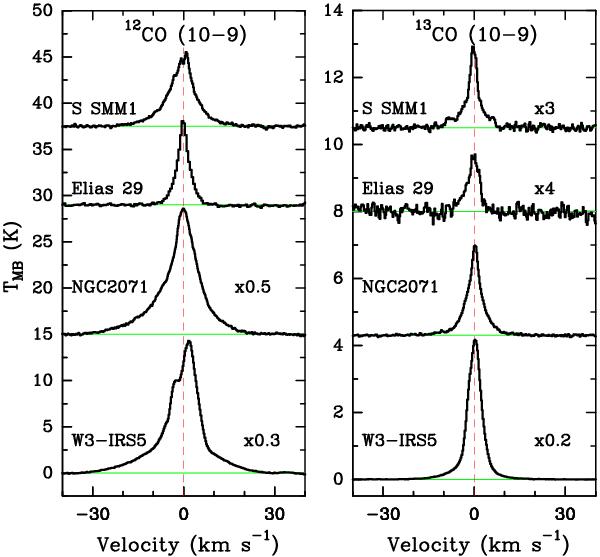
12CO J = 10–9 (left) and 13CO J = 10–9 (right) spectra for a low-mass Class 0 protostar (top, Ser SMM1), low-mass Class I source (Elias 29), intermediate-mass object (NGC 2071) and high-mass YSO (bottom, W3-IRS5). The green line indicates the baseline level and the red dashed line the 0 km s-1 value. All spectra have been rebinned to 0.27 km s-1 and shifted with respect to their relative local standard-of-rest velocity.
Current usage metrics show cumulative count of Article Views (full-text article views including HTML views, PDF and ePub downloads, according to the available data) and Abstracts Views on Vision4Press platform.
Data correspond to usage on the plateform after 2015. The current usage metrics is available 48-96 hours after online publication and is updated daily on week days.
Initial download of the metrics may take a while.