Fig. A.5
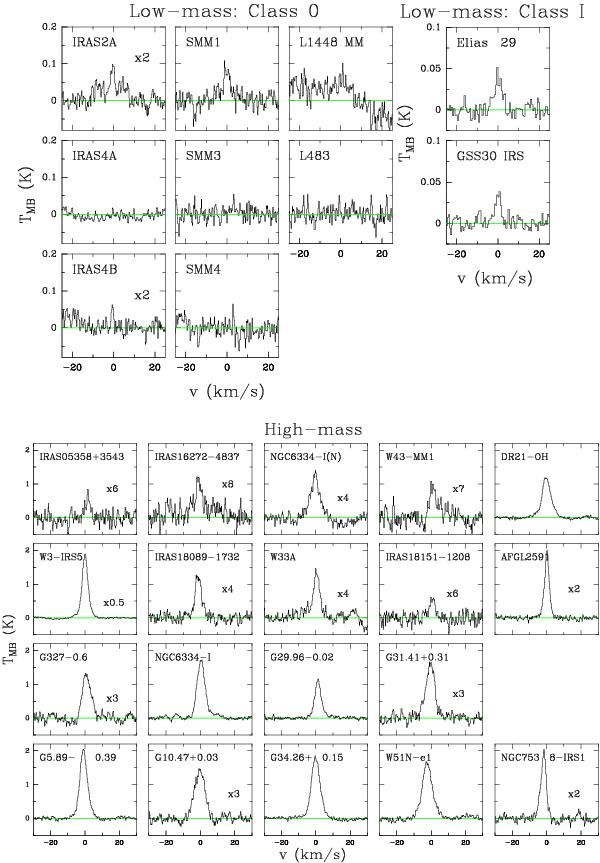
Same as Fig. A.1 but for the C18O J = 10–9 spectra of the observed low- and high-mass YSOs. In the case of the high-mass sources, the YSOs are organised as in Fig. A.2. The line wings of the 312 − 303 water transition for the high-mass sources have been fitted with a Gaussian profile, subtracted, and the residuals plotted to isolate the C18O J = 10–9 emission line.
Current usage metrics show cumulative count of Article Views (full-text article views including HTML views, PDF and ePub downloads, according to the available data) and Abstracts Views on Vision4Press platform.
Data correspond to usage on the plateform after 2015. The current usage metrics is available 48-96 hours after online publication and is updated daily on week days.
Initial download of the metrics may take a while.