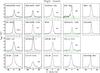
Fig. A.2
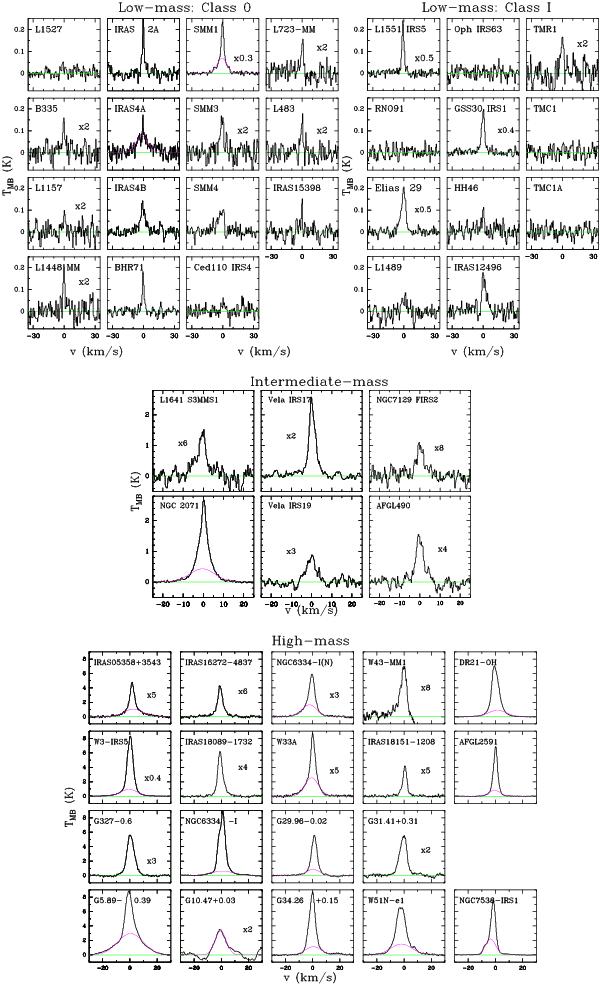
Same as Fig. A.1 but for the 13CO J = 10–9 spectra from the observed low-, intermediate- and high-mass YSOs. In the figure with the high-mass sample, the sources are presented according to their evolutionary stage. In the first row we find the mid-IR-quiet high-mass protostellar objects (HMPOs), in the second row the mid-IR-bright HMPOs, in the third line hot molecular cores and in the last row the ultra-compact Hii regions.
Current usage metrics show cumulative count of Article Views (full-text article views including HTML views, PDF and ePub downloads, according to the available data) and Abstracts Views on Vision4Press platform.
Data correspond to usage on the plateform after 2015. The current usage metrics is available 48-96 hours after online publication and is updated daily on week days.
Initial download of the metrics may take a while.