Fig. A.1
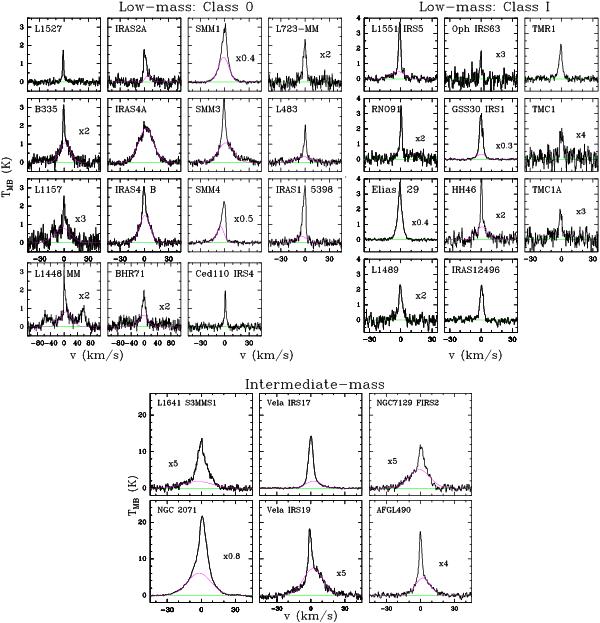
12CO J = 10–9 spectra for low- and intermediate-mass YSOs. The green line represents the baseline level and the pink Gaussian profile the broad velocity component for those sources for which a two Gaussian decomposition has been performed. All the spectra have been shifted to zero velocity. The numbers indicate where the spectra have been scaled for greater visibility.
Current usage metrics show cumulative count of Article Views (full-text article views including HTML views, PDF and ePub downloads, according to the available data) and Abstracts Views on Vision4Press platform.
Data correspond to usage on the plateform after 2015. The current usage metrics is available 48-96 hours after online publication and is updated daily on week days.
Initial download of the metrics may take a while.