Fig. 12
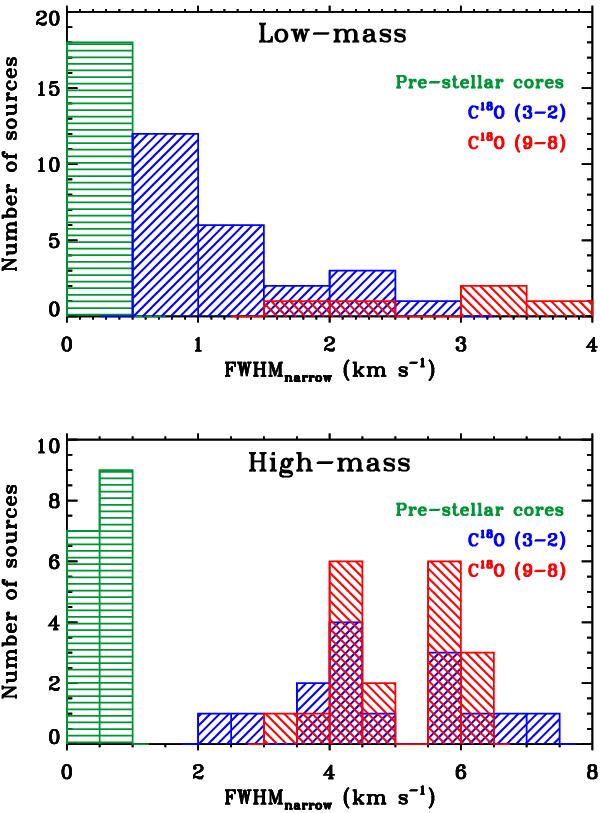
Comparison of the observed width of the ammonia line for a sample of low-mass pre-stellar cores collected by Jijina et al. (1999) (green), width of the C18O J = 3–2 spectra (blue) and C18O J = 9–8 line widths (red) for the detected WISH sample of low-mass protostars (top). The histogram of the bottom presents the same values but for high-mass pre-stellar cores and the WISH high-mass sample of YSOs.
Current usage metrics show cumulative count of Article Views (full-text article views including HTML views, PDF and ePub downloads, according to the available data) and Abstracts Views on Vision4Press platform.
Data correspond to usage on the plateform after 2015. The current usage metrics is available 48-96 hours after online publication and is updated daily on week days.
Initial download of the metrics may take a while.