Fig. 10
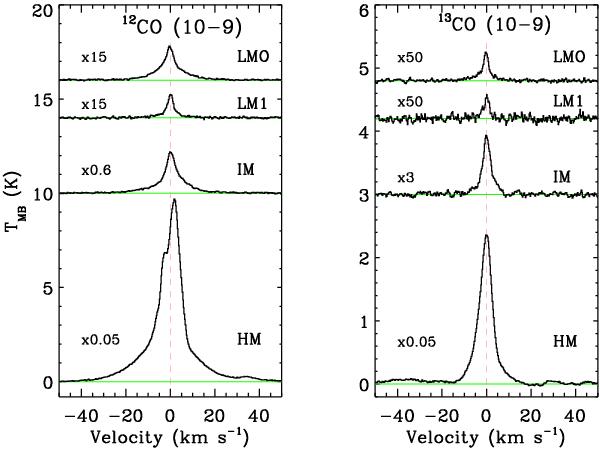
12CO J = 10–9 (left) and 13CO J = 10–9 (right) spectra of low-mass class 0 (LM0), low-mass Class I (LMI), intermediate-mass (IM) and high-mass YSO (HM) averaged independently and compared. All spectra were shifted to 0 km s-1, rebinned to 0.27 km s-1 and the intensity of the emission line scaled to a common distance of 1 kpc before averaging. The green line indicates the continuum level and the red dashed line the 0 km s-1 value. W43-MM1 was not included in the average of 13CO J = 10–9 high-mass spectra because of the strong absorption features caused by H2O+ (see Sect. 2.2).
Current usage metrics show cumulative count of Article Views (full-text article views including HTML views, PDF and ePub downloads, according to the available data) and Abstracts Views on Vision4Press platform.
Data correspond to usage on the plateform after 2015. The current usage metrics is available 48-96 hours after online publication and is updated daily on week days.
Initial download of the metrics may take a while.