Fig. 1
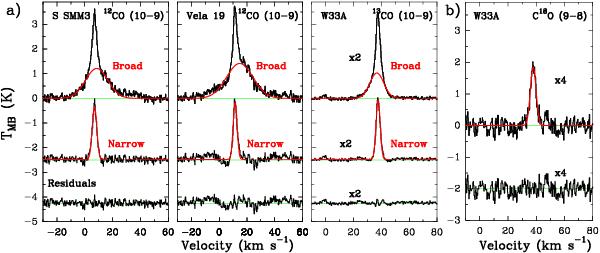
Gaussian decomposition for the CO and isotopologues line profiles: a) two Gaussian fit for the line profiles with two different velocity components identified, such as the 12CO J = 10–9 spectra for the low-mass YSOs Ser SMM3 (left), the intermediate-mass Vela 19 (centre) and the 13CO J = 10–9 spectrum of the high-mass W33A (right). b) Single Gaussian fit of sources characterised by one component profile, such as the C18O J = 9–8 spectra of W33A. The red lines show the Gaussian fits and the green lines the baseline.

Current usage metrics show cumulative count of Article Views (full-text article views including HTML views, PDF and ePub downloads, according to the available data) and Abstracts Views on Vision4Press platform.
Data correspond to usage on the plateform after 2015. The current usage metrics is available 48-96 hours after online publication and is updated daily on week days.
Initial download of the metrics may take a while.