Fig. 1
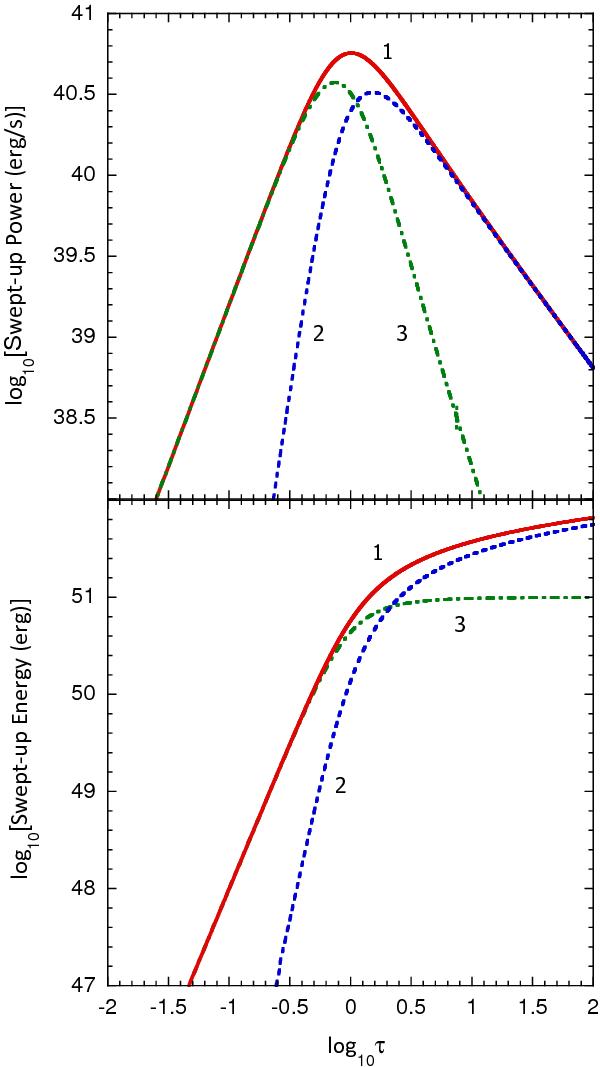
Top: rate at which kinetic energy is swept into the SNR shell (red curve, labeled “1”), rate at which kinetic energy is lost due to deceleration of the shell (blue curve, labeled “2”), and the net rate of change of kinetic energy in the SNR shell (green curve, labeled “3”). Bottom: integrated kinetic energy corresponding to the three terms shown in the upper panel. Curve 3 gives the accumulated swept-up kinetic energy, Esu(t).
Current usage metrics show cumulative count of Article Views (full-text article views including HTML views, PDF and ePub downloads, according to the available data) and Abstracts Views on Vision4Press platform.
Data correspond to usage on the plateform after 2015. The current usage metrics is available 48-96 hours after online publication and is updated daily on week days.
Initial download of the metrics may take a while.