Fig. 9
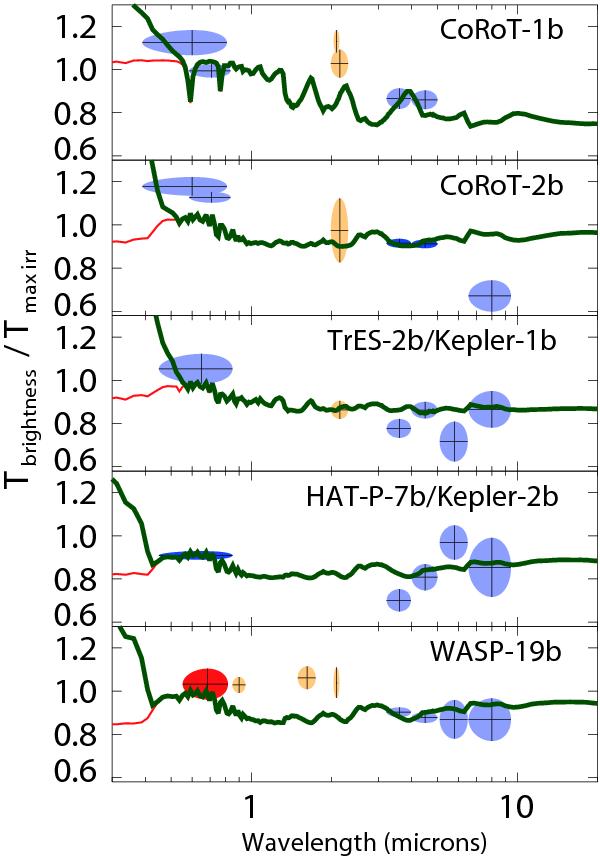
Ratio of the brightness temperature to the maximum irradiation temperature (at the substellar point – see text) versus wavelengths for exoplanets with detected visible and infrared secondary eclipses. Green and red curves correspond to the total modeled spectrum and to the thermal emission alone, respectively. The ellipses account both for the bandpasses of the observations (horizontally) and the uncertainties of the measurements (vertically). The colors indicate whether the data come from space telescopes (blue), midlatitude ground based facilities (orange), or ASTEP 400 (red).
Current usage metrics show cumulative count of Article Views (full-text article views including HTML views, PDF and ePub downloads, according to the available data) and Abstracts Views on Vision4Press platform.
Data correspond to usage on the plateform after 2015. The current usage metrics is available 48-96 hours after online publication and is updated daily on week days.
Initial download of the metrics may take a while.