Free Access
Fig. 8
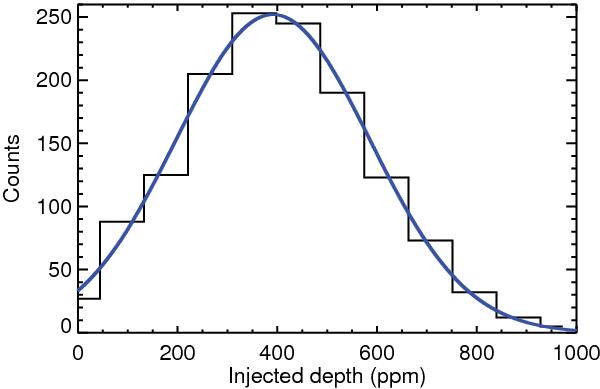
Histogram showing the depth of injected events that were detected in the MC simulation, at the specific measured depth of 390 (a vertical ± 40 ppm bin through the diagram of Fig. 7 top). The blue curve shows the best-fit Gaussian of the histogram.
Current usage metrics show cumulative count of Article Views (full-text article views including HTML views, PDF and ePub downloads, according to the available data) and Abstracts Views on Vision4Press platform.
Data correspond to usage on the plateform after 2015. The current usage metrics is available 48-96 hours after online publication and is updated daily on week days.
Initial download of the metrics may take a while.