Fig. 7
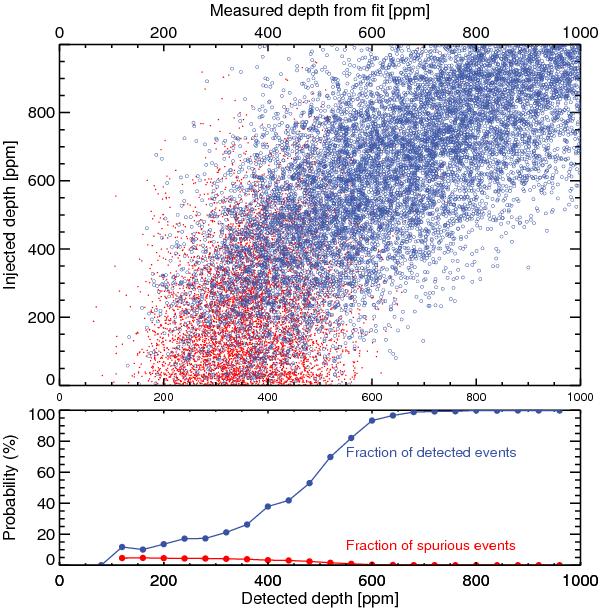
(Top) Result of the Monte-Carlo simulation points (see text for details). The blue circles show the detected events (i.e. with the phase of the fit matching the expected eclipse location ± 2.5% in phase unit), whilst the red dots show non detected events (i.e. the result of the fit not matching the expected phase location ± 2.5%). (Bottom) The detection (blue) and false alarm (red) probability curves derived from the Monte-Carlo simulation. The detection probability – for a given depth – is the ratio between the number of detected events (blue circles) over the total number of events (red plus blue).
Current usage metrics show cumulative count of Article Views (full-text article views including HTML views, PDF and ePub downloads, according to the available data) and Abstracts Views on Vision4Press platform.
Data correspond to usage on the plateform after 2015. The current usage metrics is available 48-96 hours after online publication and is updated daily on week days.
Initial download of the metrics may take a while.