Fig. 6
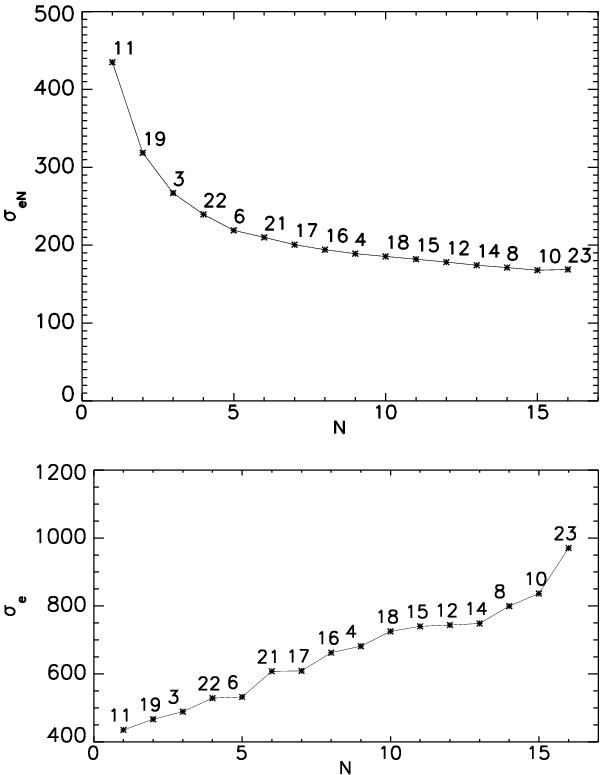
Standard deviation of the folded lightcurve for 1 h bins against the number of folded nights (from best to worst). The numbers along the curve correspond to each of the newly added night number: the first point corresponds to a single night whilst the latest corresponds to the 23 nights. The lower panel shows the σek value for each night.
Current usage metrics show cumulative count of Article Views (full-text article views including HTML views, PDF and ePub downloads, according to the available data) and Abstracts Views on Vision4Press platform.
Data correspond to usage on the plateform after 2015. The current usage metrics is available 48-96 hours after online publication and is updated daily on week days.
Initial download of the metrics may take a while.