Fig. 7
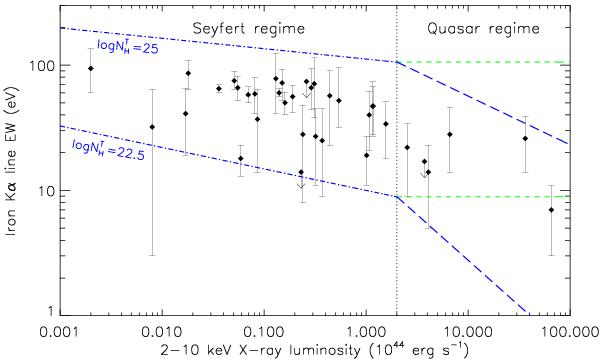
Iron Kα EW versus X-ray luminosities and predicted trends obtained
for different values of the equatorial column density of the torus. The points are
the values of the EW of the iron Kα line reported by Shu et al. (2010) and obtained by averaging
multiple Chandra/HEG observations of AGN. The two blue dash-dotted
lines are the fits to our simulations of the X-ray Baldwin effect using the
θOA − LX relationship of
Hasinger (2008) for the Seyfert regime
(log EW = 1.01−0.17log LX,44
for  , and
log EW = 2.05−0.08log LX,44
for
, and
log EW = 2.05−0.08log LX,44
for  ). The blue long-dashed
lines represent the EW − LX relations
obtained in the quasar regime
(log EW = 1.17−0.73log LX,44
for and
log EW = 2.14−0.39log LX,44
for ) using the
relationship of Hasinger (2008), while the
green dashed lines represent those attained using the relationship of Burlon et al. (2011). The intercepts obtained in
the quasar regime have been modified to match those obtained at lower
luminosities.
). The blue long-dashed
lines represent the EW − LX relations
obtained in the quasar regime
(log EW = 1.17−0.73log LX,44
for and
log EW = 2.14−0.39log LX,44
for ) using the
relationship of Hasinger (2008), while the
green dashed lines represent those attained using the relationship of Burlon et al. (2011). The intercepts obtained in
the quasar regime have been modified to match those obtained at lower
luminosities.
Current usage metrics show cumulative count of Article Views (full-text article views including HTML views, PDF and ePub downloads, according to the available data) and Abstracts Views on Vision4Press platform.
Data correspond to usage on the plateform after 2015. The current usage metrics is available 48-96 hours after online publication and is updated daily on week days.
Initial download of the metrics may take a while.