Fig. 2
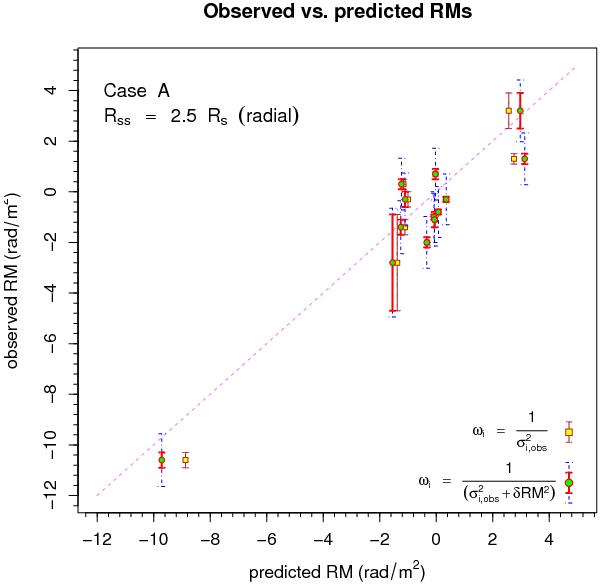
Scatter plot of predicted RMs versus observed RMs in the best-fit parameter configuration, using a model with B01 left as free parameter and setting Cn = 1. Results are displayed for the two cases of non-uniform weights, after the two analyses described in step 1 (yellow squares) and step 2 (green circles), respectively. The dashed 1:1 line shows the diagonal, corresponding to the ideal situation where predicted and measured values are equal. The solid (red and brown) error bars denote the σRM,i uncertainties for each measurement due to radiometer noise as quoted in Mancuso & Spangler (2000), whereas the dashed (blue) errorbars denote the σRM,i∗ total uncertainties obtained after adding the contribution of RM fluctuations, estimated to be δRM = 1 rad m-2 for the sake of this analysis.
Current usage metrics show cumulative count of Article Views (full-text article views including HTML views, PDF and ePub downloads, according to the available data) and Abstracts Views on Vision4Press platform.
Data correspond to usage on the plateform after 2015. The current usage metrics is available 48-96 hours after online publication and is updated daily on week days.
Initial download of the metrics may take a while.