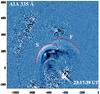
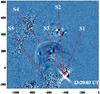
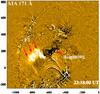
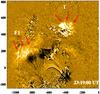
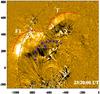
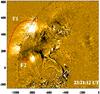
Fig. 7
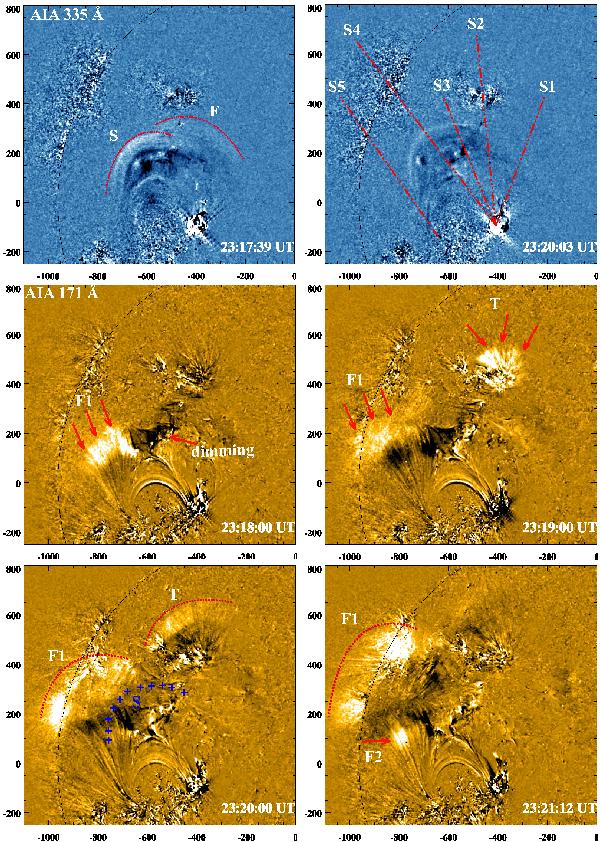
AIA 335 and 171 Å EUV running-difference images showing the propagation of EUV waves on 25 March 2011. “F” and “S” indicate the faster and slower wavefronts, respectively. The slices selected for the space-time intensity plots are marked by “S1” to “S5” (top-right). “F1” and “F2” also represent the fast wavefronts, while “T” shows the transmitted wavefront from AR NOAA 11177. X and Y axes are given in arcsecs.
Current usage metrics show cumulative count of Article Views (full-text article views including HTML views, PDF and ePub downloads, according to the available data) and Abstracts Views on Vision4Press platform.
Data correspond to usage on the plateform after 2015. The current usage metrics is available 48-96 hours after online publication and is updated daily on week days.
Initial download of the metrics may take a while.