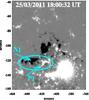
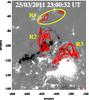
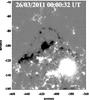
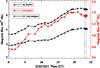
Fig. 5
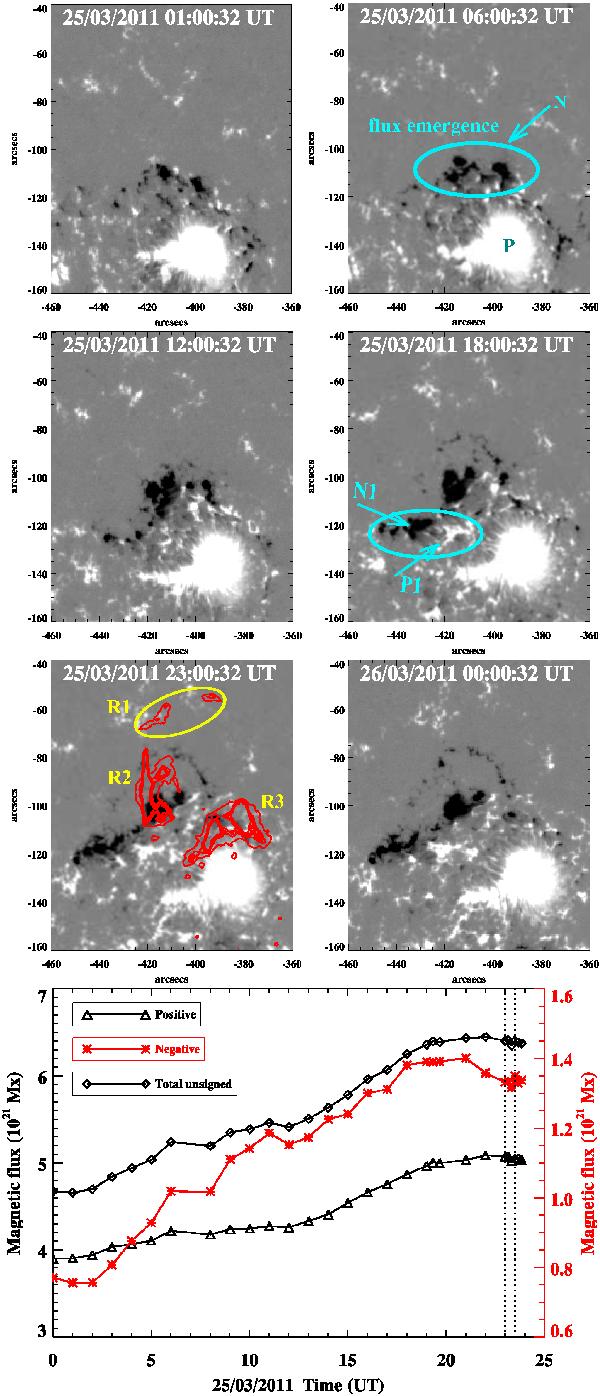
HMI magnetograms showing the magnetic flux emergence at the site of the blob eruption. The magnetogram at 23:00 UT is overlaid with the AIA 1600 Å EUV flare ribbons near the flux emergence site. Bottom: the temporal evolution of positive, unsigned negative, and total unsigned flux derived from the HMI magnetograms on 25 March 2011. Two vertical dotted lines indicate the duration of blob eruption and the associated flare.
Current usage metrics show cumulative count of Article Views (full-text article views including HTML views, PDF and ePub downloads, according to the available data) and Abstracts Views on Vision4Press platform.
Data correspond to usage on the plateform after 2015. The current usage metrics is available 48-96 hours after online publication and is updated daily on week days.
Initial download of the metrics may take a while.