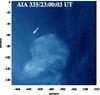
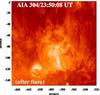
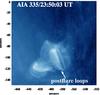
Fig. 4
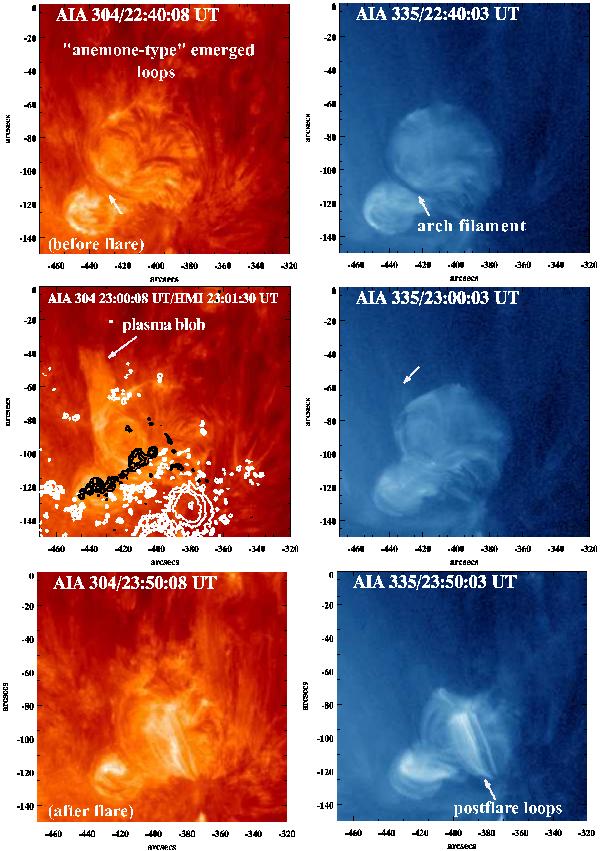
SDO/AIA 304 and 335 Å images of the blob formation site before and after the flare. The plasma blob was formed above the arch filament (indicated by arrows) at the site of the emerging anemone-type loops. The AIA 304 Å image in the middle panel is overlaid with the HMI magnetogram contours of positive (white) and negative (black) polarities. The contour levels are ± 200, ± 500, ± 1000, and ± 2000 G.
Current usage metrics show cumulative count of Article Views (full-text article views including HTML views, PDF and ePub downloads, according to the available data) and Abstracts Views on Vision4Press platform.
Data correspond to usage on the plateform after 2015. The current usage metrics is available 48-96 hours after online publication and is updated daily on week days.
Initial download of the metrics may take a while.