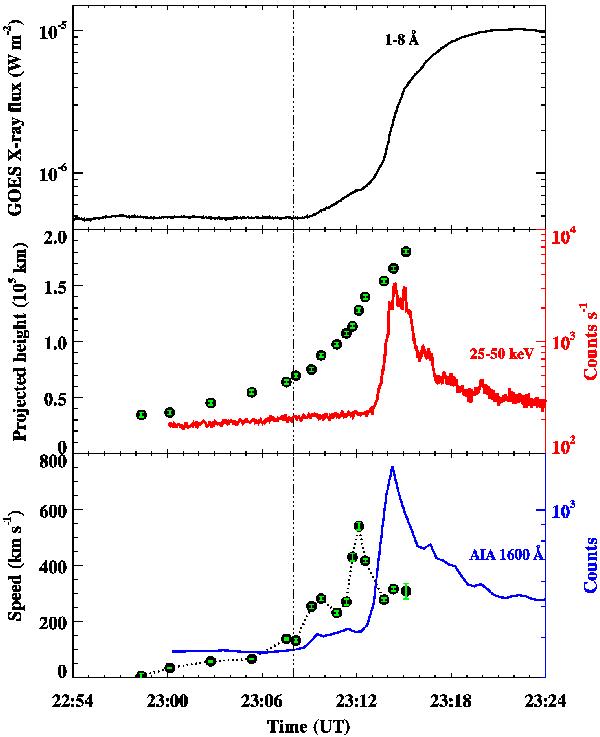
Fig. 3

Top: GOES soft X-ray flux profile in the 1−8 Å wavelength channel. Middle: projected height-time of the blob plotted with the hard X-ray flux profile in the energy range of 25−50 keV observed with the Fermi Gamma-ray Burst Monitor. Bottom: temporal evolution of the blob speed derived by the height-time measurements using AIA 131 Å images. The AIA 1600 Å average integrated counts profile is plotted as a blue curve. The uncertainty in the speed estimate is mainly due to the error in the height measurement, which is assumed to be four pixels (i.e., 2.4″). The vertical dotted line shows start time of the flare at 23:08 UT.
Current usage metrics show cumulative count of Article Views (full-text article views including HTML views, PDF and ePub downloads, according to the available data) and Abstracts Views on Vision4Press platform.
Data correspond to usage on the plateform after 2015. The current usage metrics is available 48-96 hours after online publication and is updated daily on week days.
Initial download of the metrics may take a while.


