Fig. 12
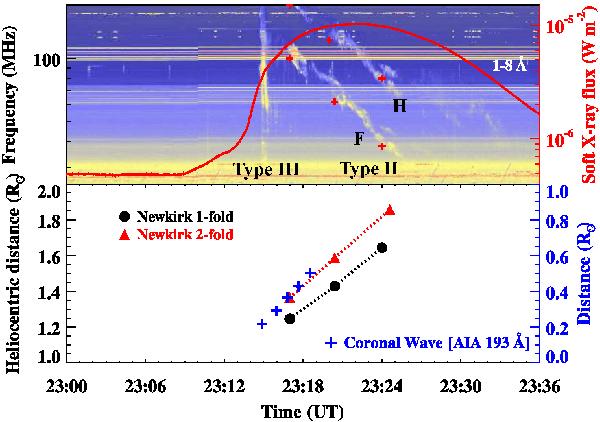
Top: radio dynamic spectrum from the Learmonth observatory, Australia in the 25−180 MHz frequency range plotted against the GOES soft X-ray flux in 1−8 Å. The radio spectrum shows narrow type III and type II radio bursts during the M-class flare. “F” and “H” indicate the fundamental and second-harmonic band emission, respectively. Bottom: emission heights of type II radio burst (from fundamental band) in the corona estimated from the Newkirk one-fold and two-fold coronal density models. The distance-time profile of the coronal wave is also included.
Current usage metrics show cumulative count of Article Views (full-text article views including HTML views, PDF and ePub downloads, according to the available data) and Abstracts Views on Vision4Press platform.
Data correspond to usage on the plateform after 2015. The current usage metrics is available 48-96 hours after online publication and is updated daily on week days.
Initial download of the metrics may take a while.