Fig. 11
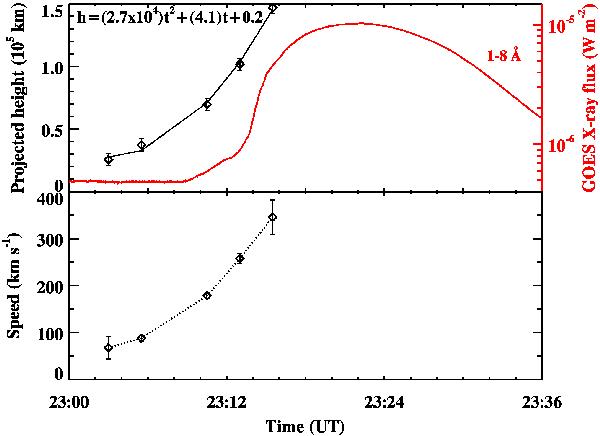
Top: blob projected height-time (derived from the STEREO-B 195 Å images) plot with quadratic fit to the measurements. The equation of the fitted curve is h = (2.7 × 10⁴)t2 + (4.1)t + 0.2, where “h” is the height (in km) and “t” is the time (in sec) from 23:03 UT. The red curve shows the GOES soft X-ray flux profile in 1−8 Å. Bottom: temporal evolution of the blob speed derived from height-time measurements. The typical error in the height estimate is four pixels (6.4″).
Current usage metrics show cumulative count of Article Views (full-text article views including HTML views, PDF and ePub downloads, according to the available data) and Abstracts Views on Vision4Press platform.
Data correspond to usage on the plateform after 2015. The current usage metrics is available 48-96 hours after online publication and is updated daily on week days.
Initial download of the metrics may take a while.