Fig. 8
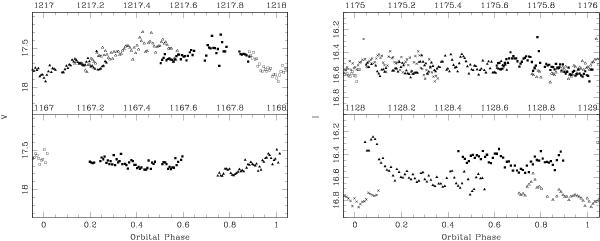
Light curves of V479 And in V and I bands as indicated on the panels and obtained at four different epochs are folded with the orbital period. The integer numbers at the X-axes above each panel correspond to the orbital cycle in which the data plotted with filled squares were taken, the decimals correspond to the orbital phases. The data from immediately previous and following orbital cycles are marked with different symbols. The magnitudes at the Y-axes are calibrated using secondary standards in the field of the object.
Current usage metrics show cumulative count of Article Views (full-text article views including HTML views, PDF and ePub downloads, according to the available data) and Abstracts Views on Vision4Press platform.
Data correspond to usage on the plateform after 2015. The current usage metrics is available 48-96 hours after online publication and is updated daily on week days.
Initial download of the metrics may take a while.