Fig. 6
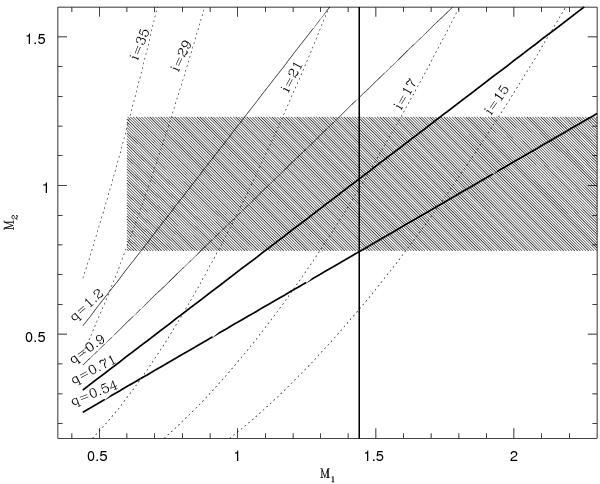
M2–M1 diagram for V479 And. The solution probably lies between thick diagonal lines corresponding to q = 0.54 and 0.7 as measured by RV amplitude ratio of He ii and Hβ emission lines to the absorption. Dashed curves denote the orbital inclination of the system. The shaded area corresponds to the mass range of a K0 star from ZAMS to luminosity class IV.
Current usage metrics show cumulative count of Article Views (full-text article views including HTML views, PDF and ePub downloads, according to the available data) and Abstracts Views on Vision4Press platform.
Data correspond to usage on the plateform after 2015. The current usage metrics is available 48-96 hours after online publication and is updated daily on week days.
Initial download of the metrics may take a while.