Fig. 5
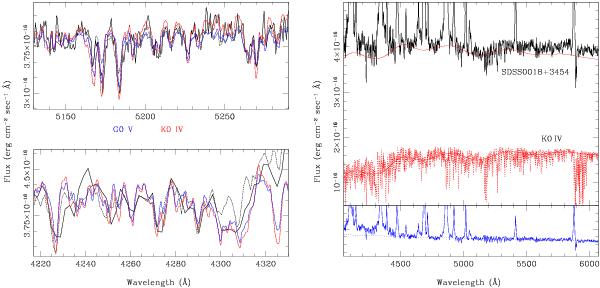
Spectra of V479 And (black) and standard stars. In the right upper panel we show the observed spectrum of the object along with a K0 IV star (red, dotted), scaled to reflect the real contribution of the secondary star to the total flux. The continuous red line over the K0 star is a high-order polynomial fit to the spectrum excluding strong absorption features. In the lower right panel, the residual (V479 And minus K0 IV) is plotted. It is well-described by a power law plotted by the dashed (blue) line. This power law is summed with the fit to the secondary star spectrum and plotted over the object in the upper panel to illustrate coincidences of the troughs in the continuum. In the left panels zoomed portions of the spectra are displayed in the λλ 4220−4340 Å (bottom) and λλ 5100−5300 Å (top) intervals. The thick black line in the left panels corresponds to the SPM spectrum, while the dotted line shows the SDSS spectrum. Two standard stars are plotted in colors, G0 V in blue, and K0 IV in red. The standard star spectra are scaled to overlap with the object in each spectral interval separately. The SPM spectra in the left panels are combined after correction for the secondary star orbital motion to increase the signal-to-noise ratio.
Current usage metrics show cumulative count of Article Views (full-text article views including HTML views, PDF and ePub downloads, according to the available data) and Abstracts Views on Vision4Press platform.
Data correspond to usage on the plateform after 2015. The current usage metrics is available 48-96 hours after online publication and is updated daily on week days.
Initial download of the metrics may take a while.