Fig. 4
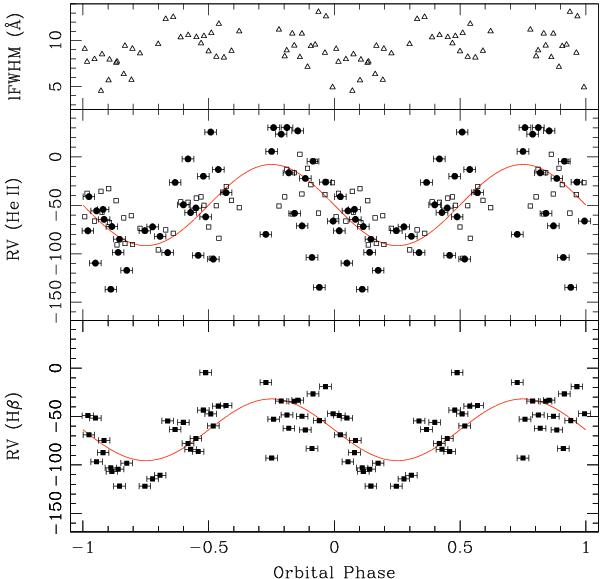
Emission line measurements of V479 And from 2010 higher resolution spectra. The radial velocities of Hβ and He ii measured by a double-Gaussian method are marked by solid black squares in the bottom and middle panel. The horizontal bars attached to each point indicate the duration of individual exposures. The radial velocity curves obtained as sinusoidal fits to these points are overplotted. In the middle panel measurements of He ii line by single-Lorentzian fits are marked by open squares. The upper panel shows measurements of the width of the Lorentzian profiles fitted to the He ii line.
Current usage metrics show cumulative count of Article Views (full-text article views including HTML views, PDF and ePub downloads, according to the available data) and Abstracts Views on Vision4Press platform.
Data correspond to usage on the plateform after 2015. The current usage metrics is available 48-96 hours after online publication and is updated daily on week days.
Initial download of the metrics may take a while.