Fig. 10
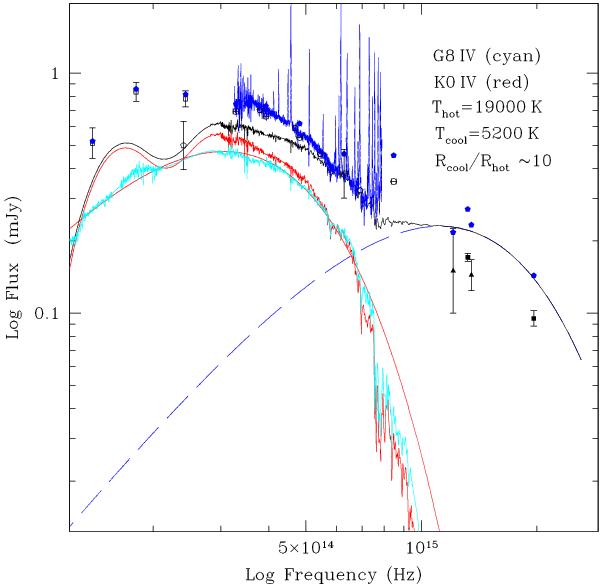
Spectral energy distribution of V479 And from UV to IR (right to left). The two black squares are the GALEX FUV and NUV measurements, triangles are Swift UVOT UVM2 & UVW1 filters followed by black circles corresponding to the SDSS ugriz bands and our own BVRIJ measurements marked with open pentagons. Finally, the three open black squares are 2MASS JHK measurements. The large vertical error bars are not measurements errors, but show the extent of variability detected in the corresponding filter during long-term monitoring. The filled blue pentagons are interstellar-extinction-corrected data using E(B − V) = 0.056 and the blue dashed line corresponds to SDSS spectrum after de-reddening. The continuous red and dashed blue lines are simultaneous black body fits to the observations with 5200 and 19 000 K, respectively. The cool black body corresponds to the presence of a donor star in the binary system and is also represented by K0 IV or G8 IV spectra of standard stars. The black continuous line is the sum of the K0 IV spectrum and a 19 000 K black body, which appears to fit most of the observed data well.
Current usage metrics show cumulative count of Article Views (full-text article views including HTML views, PDF and ePub downloads, according to the available data) and Abstracts Views on Vision4Press platform.
Data correspond to usage on the plateform after 2015. The current usage metrics is available 48-96 hours after online publication and is updated daily on week days.
Initial download of the metrics may take a while.