Fig. 9
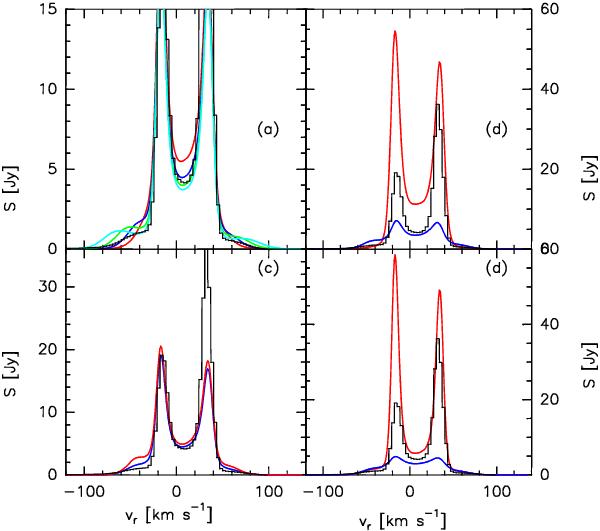
Observational (black histogram) and predicted H30α profiles varying different input parameters: a) predicted H30α profiles for terminal velocities of the ionized wind of 40, 60, 80, and 100 km s-1 (red, blue, green, and cyan). It is clearly shown that the wing humps are shifted to larger radial-velocities with increasing terminal velocities. b) predicted H30α profiles for opening angles for the Keplerian ionized layer, θd, of 4.5° and 15° (blue and red lines). c) predicted H30α profiles for electron temperatures for the ionized outflow, To, of 10 000 and 12 000 K (red and blue lines). d) predicted H30α profiles for electron temperatures for the Keplerian ionized layer, Td, of 8500 and 12 000 K (red and blue lines).
Current usage metrics show cumulative count of Article Views (full-text article views including HTML views, PDF and ePub downloads, according to the available data) and Abstracts Views on Vision4Press platform.
Data correspond to usage on the plateform after 2015. The current usage metrics is available 48-96 hours after online publication and is updated daily on week days.
Initial download of the metrics may take a while.