Fig. 7
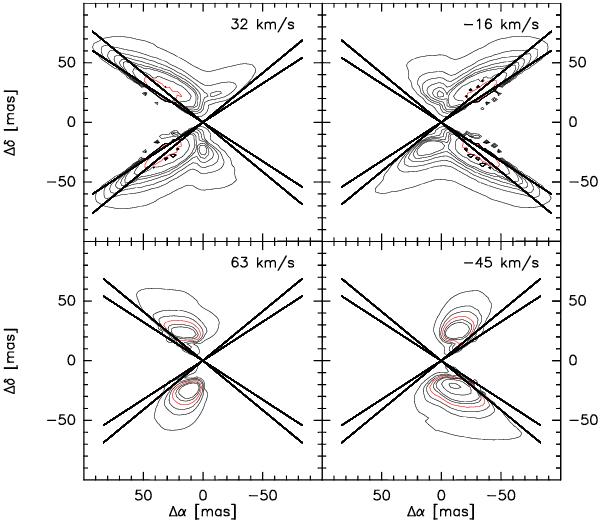
Predicted intensity line emission (Δvr = 1 km s-1) of the H30α at radial velocities of 32 (top left), − 16 (top right), 63 (bottom left), and − 45 km s-1 (bottom right). Contour levels are 0.5, 1.5, 2.5, 4.0, 6.0, 8.0, 20.0 and 80.0 mJy. The contour level of 80.0 mJy (corresponding to an optical depth of − 3.6) of the upper panels (red contour levels) contain ~80% of the total emission, while the contour level of 4.0 mJy (corresponding to an optical depth of − 0.8) of the bottom panels (red contour levels) contain ~50 and 70% of the total emission (left and right, respectively). It shows that at the radial velocities of the spikes (upper panels), the emission mainly originates at points located close to the projection of the ionized disk (whose edges are represented as straight lines for θi = 0) into the source’s plane of symmetry perpendicular to the line-of-sight.
Current usage metrics show cumulative count of Article Views (full-text article views including HTML views, PDF and ePub downloads, according to the available data) and Abstracts Views on Vision4Press platform.
Data correspond to usage on the plateform after 2015. The current usage metrics is available 48-96 hours after online publication and is updated daily on week days.
Initial download of the metrics may take a while.