Fig. 6
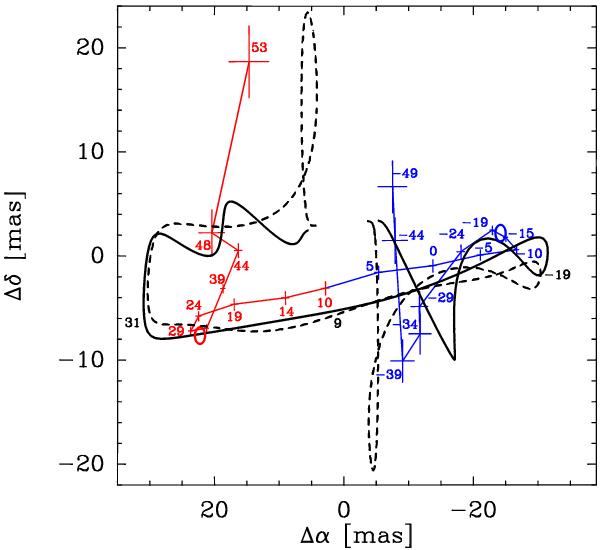
Model prediction for the relative centroid positions of the H30α
emission (solid and dashed thick lines for the cases with rotating and non-rotating
outflow) in the velocity range between − 64 km s-1 and 58
km s-1 superimposed on the observed data as blue and red thin lines for
MWC349A. The positions of the line velocity channels are shown as crosses labeled by
their LSR velocities. The blueshifted and redshifted maser spikes (− 16 and 32
km s-1, respectively) peak at the blue and red circles. The associated
errors are shown by horizontal and vertical bars. The offsets are in milliarcseconds
(mas) relative to the continuum centroid ( ,
δJ2000 = 40°39′36.8′′).
,
δJ2000 = 40°39′36.8′′).
Current usage metrics show cumulative count of Article Views (full-text article views including HTML views, PDF and ePub downloads, according to the available data) and Abstracts Views on Vision4Press platform.
Data correspond to usage on the plateform after 2015. The current usage metrics is available 48-96 hours after online publication and is updated daily on week days.
Initial download of the metrics may take a while.