Fig. 5
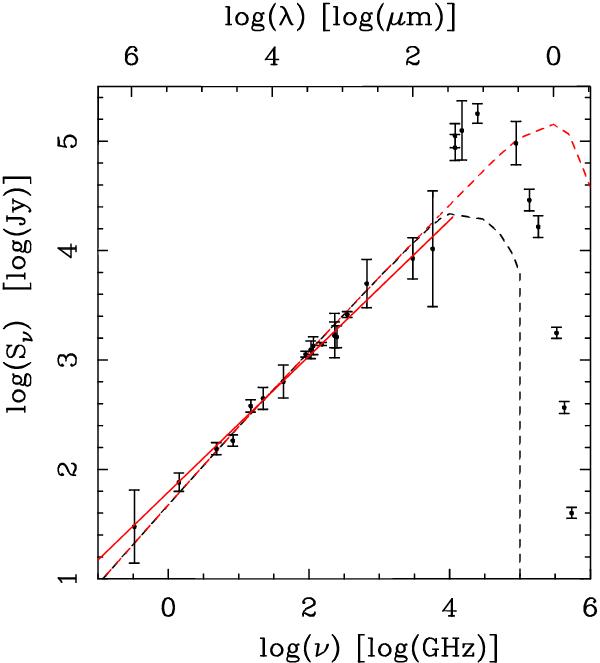
Observed (vertical bars) and modelled (dashed lines) SEDs for MWC349A. The black and red dashed lines represent the predictions for ionized stellar winds extending down to rmin = 3 and 0.05 AU, respectively. The red solid line shows the linear fit to the observational intensities (with ν < 5.77 THz), yielding a spectral index of 0.62. Observational data were obtained from Allen (1973); Altenhoff et al. (1994); Beichman (1988); Harvey et al. (1979); Lee (1970); Martín-Pintado et al. (1989a); Martín-Pintado et al. (1994); Planesas et al. (1992); Sandell et al. (2011); Schwartz (1980); Simon & Dyck (1977); and Tafoya et al. (2004). All the observational data available so far was concisely compiled by Lugo et al. (2004).
Current usage metrics show cumulative count of Article Views (full-text article views including HTML views, PDF and ePub downloads, according to the available data) and Abstracts Views on Vision4Press platform.
Data correspond to usage on the plateform after 2015. The current usage metrics is available 48-96 hours after online publication and is updated daily on week days.
Initial download of the metrics may take a while.