Fig. 4
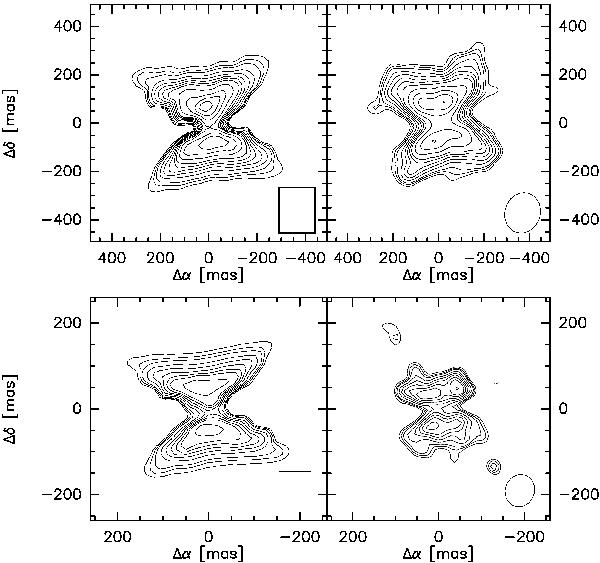
Modelled (left) and observed (right panel, by Tafoya et al. 2004) radio-continuum maps for 1.3 cm (top) and 7 mm (bottom). Contours are − 5, − 4, 4, 5, 6, 8, 10, 12, 14, 16, 20, 25, 30, 35, 40, 50, 60, 70, 80, 90, 100, and 110 times the rms of the observational VLA image (727 and 859 μJy beam-1 for the 1.3 cm and 7 mm images, respectively). The modelled maps were obtained by the convolution of the original data with a box of the same size as the HPBW of the observations) and rotating the image by 8° anticlockwise.
Current usage metrics show cumulative count of Article Views (full-text article views including HTML views, PDF and ePub downloads, according to the available data) and Abstracts Views on Vision4Press platform.
Data correspond to usage on the plateform after 2015. The current usage metrics is available 48-96 hours after online publication and is updated daily on week days.
Initial download of the metrics may take a while.