Fig. 2
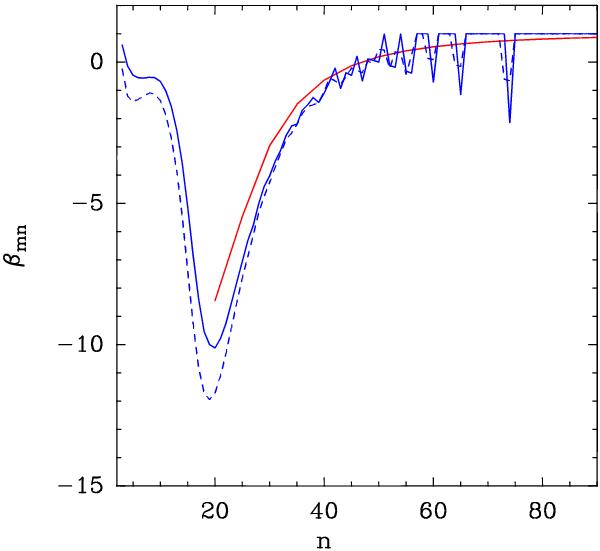
Estimated βmn coefficients, bn for an ionized gas with electron density of 107 cm-3, and electron temperature of 10 000 K. The solid red line shows the βmn values derived by Walmsley (1990) for Hnα transitions, while the solid and dashed blue lines show the values derived by Storey & Hummer (1995) for Hnα and Hnβ transitions, respectively. The observed zig-zag for the βmnStorey & Hummer (1995) coefficients for n > is due to the numerical error in deriving them from Eq. (8). This error increases for increasing n since the relative difference between the bm and bn decreases as observed in Fig. 1.
Current usage metrics show cumulative count of Article Views (full-text article views including HTML views, PDF and ePub downloads, according to the available data) and Abstracts Views on Vision4Press platform.
Data correspond to usage on the plateform after 2015. The current usage metrics is available 48-96 hours after online publication and is updated daily on week days.
Initial download of the metrics may take a while.