Fig. 12
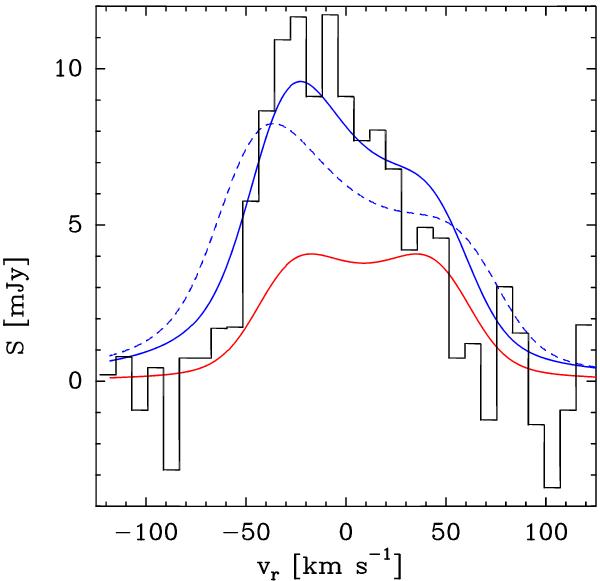
Observed (black histogram, Escalante et al. 1989) and predicted H76α profile in the non-LTE (blue lines) and LTE case (red line). For the non-LTE case, we have plotted the predicted profiles for two different outflow terminal velocities, 60 and 80 km s-1 (solid and dashed lines, respectively). We clearly see that the line width is only explained if one assumes 60 km s-1.
Current usage metrics show cumulative count of Article Views (full-text article views including HTML views, PDF and ePub downloads, according to the available data) and Abstracts Views on Vision4Press platform.
Data correspond to usage on the plateform after 2015. The current usage metrics is available 48-96 hours after online publication and is updated daily on week days.
Initial download of the metrics may take a while.