Fig. 10
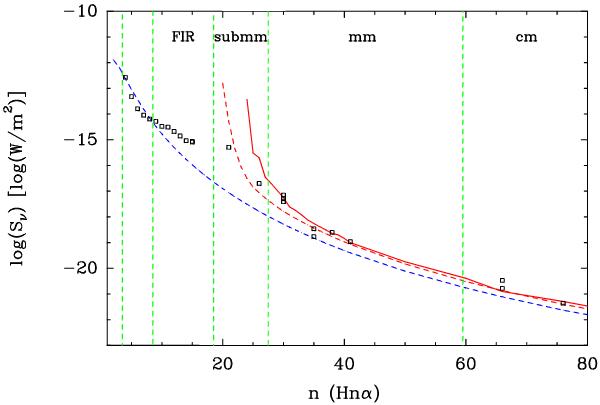
Integrated line intensities for the whole range of quantum numbers n of the observed Hnα RRLs. Open squares refer to the observational data, while the lines show the LTE (blue line) and non-LTE prediction of our model (dashed and solid red lines for the cases of the Walmsley and the Storey & Hummer bn coefficients respectively). With green dashed lines we show the limits among the different wavelength ranges. References for the observational data: H4α to H15α Thum et al. (1998); H21αThum et al. (1994b); H26α and H30α Thum et al. (1994a); H30α Martín-Pintado et al. (1989a); H35α and H38αMartín-Pintado et al. (1994); H41α Martín-Pintado et al. (1989a); H66α Loinard & Rodríguez (2010); H66α Martín-Pintado et al. (1993); H76α Escalante et al. (1989).
Current usage metrics show cumulative count of Article Views (full-text article views including HTML views, PDF and ePub downloads, according to the available data) and Abstracts Views on Vision4Press platform.
Data correspond to usage on the plateform after 2015. The current usage metrics is available 48-96 hours after online publication and is updated daily on week days.
Initial download of the metrics may take a while.