Fig. 6
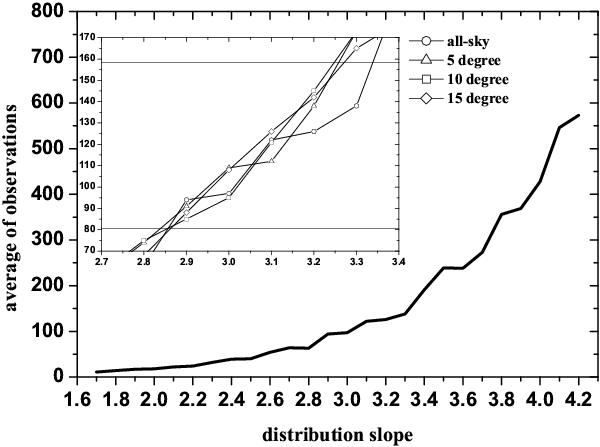
Variation in the power law slope vs. average number of observations to obtain a Sedna-like object for the scenario of the star cluster, considering four values for the allowed latitude range. The small panel represents a zoom for the range 70−170 observations. The thick curve represents the simulation without restriction in latitude.
Current usage metrics show cumulative count of Article Views (full-text article views including HTML views, PDF and ePub downloads, according to the available data) and Abstracts Views on Vision4Press platform.
Data correspond to usage on the plateform after 2015. The current usage metrics is available 48-96 hours after online publication and is updated daily on week days.
Initial download of the metrics may take a while.