Fig. 2
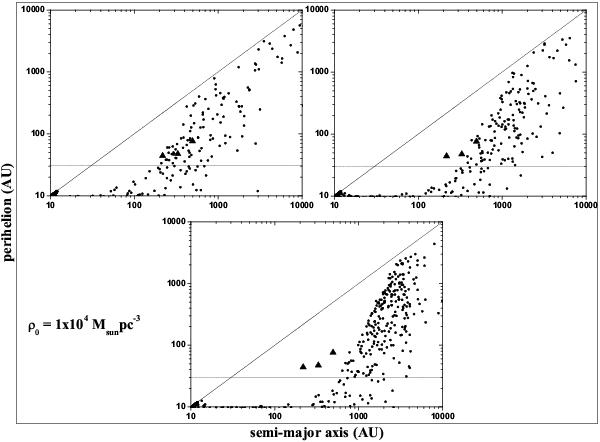
Orbital distribution of semi-major axis vs. perihelion distance for the scenario of the star cluster after 3 × 10⁶ ys: the small circles represent planetesimals and triangles represent CR105, VN112, and Sedna. Panels from left to right respectively denote star orbits close to the cluster center, intermediate, and far from the cluster center, corresponding to a density in the cluster center of 104 M⊙ pc-3.
Current usage metrics show cumulative count of Article Views (full-text article views including HTML views, PDF and ePub downloads, according to the available data) and Abstracts Views on Vision4Press platform.
Data correspond to usage on the plateform after 2015. The current usage metrics is available 48-96 hours after online publication and is updated daily on week days.
Initial download of the metrics may take a while.