Fig. 9
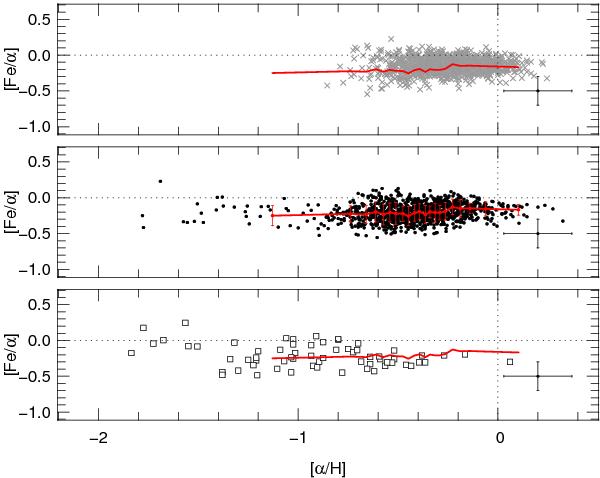
Abundance ratio [Fe/α] versus the abundance [α/H] for the thin disc component (grey crosses, top panel), the dissipative component (black points, middle panel), and the accretion component (open squares, bottom panel), selected by using our modified criteria (see text). The red line represents the average [Fe/α] of the dissipative component obtained by averaging bins of 50 points each, and the error bars represent their standard deviation. The red line is reproduced in each panel as a fiducial line. This figure corresponds to Fig. 2 of G03.
Current usage metrics show cumulative count of Article Views (full-text article views including HTML views, PDF and ePub downloads, according to the available data) and Abstracts Views on Vision4Press platform.
Data correspond to usage on the plateform after 2015. The current usage metrics is available 48-96 hours after online publication and is updated daily on week days.
Initial download of the metrics may take a while.