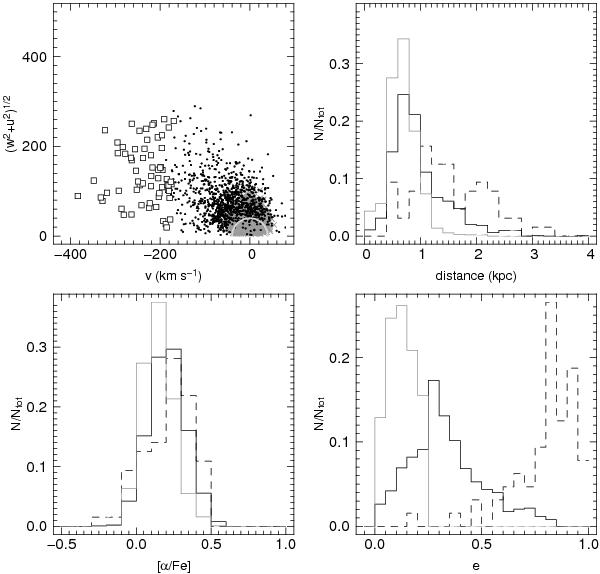
Fig. 5
Toomre diagram (upper left) for each of our samples: thin disc stars (grey points), dissipative component (mostly thick disc stars – black dots), and accretion component (squares). The light grey semi-circle indicates the constant peculiar velocity (u2 + v2 + w2)1/2 = 40 km s-1. Also shown are the distance (upper right), [α/Fe] (bottom left), and eccentricity (bottom right) distributions of the thin disc (grey line) dissipative (solid black line) and accretion (black dashed line) components.
Current usage metrics show cumulative count of Article Views (full-text article views including HTML views, PDF and ePub downloads, according to the available data) and Abstracts Views on Vision4Press platform.
Data correspond to usage on the plateform after 2015. The current usage metrics is available 48-96 hours after online publication and is updated daily on week days.
Initial download of the metrics may take a while.