Fig. 4
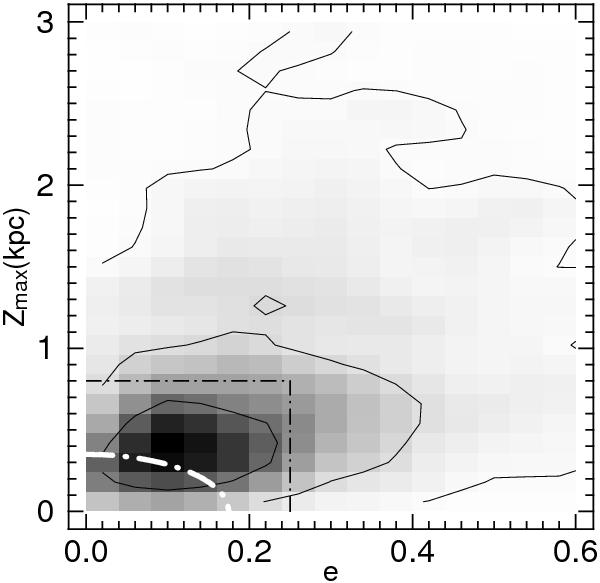
Density distribution on the e − Zmax plane for our sample SN75 sample, with 2167 stars. The dash-dotted white curve shows the G03 thin-disc selection criteria, whereas the dashed-dotted black line frames the area defined by our modification to the e and Zmax constraints. The contours contain 34%, 68% and 95% of the sample.
Current usage metrics show cumulative count of Article Views (full-text article views including HTML views, PDF and ePub downloads, according to the available data) and Abstracts Views on Vision4Press platform.
Data correspond to usage on the plateform after 2015. The current usage metrics is available 48-96 hours after online publication and is updated daily on week days.
Initial download of the metrics may take a while.