Fig. 12
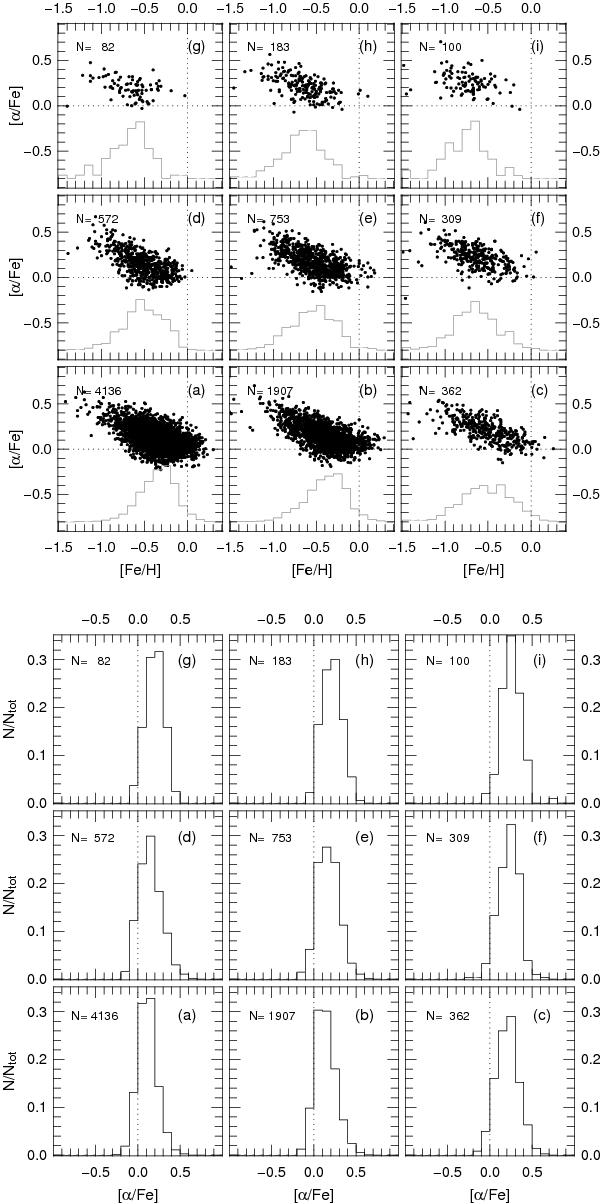
Upper panel: relative abundance [α/Fe] versus [Fe/H] for the stellar samples defined by panels a) through i) in Fig. 11. The histograms represent the Fe distributions with relative scales. Lower panel: distributions of abundance [α/Fe] for the stellar samples defined by panels a) through i) in Fig. 11. The distributions are normalized over the total number of points contained in each panel (Ntot).
Current usage metrics show cumulative count of Article Views (full-text article views including HTML views, PDF and ePub downloads, according to the available data) and Abstracts Views on Vision4Press platform.
Data correspond to usage on the plateform after 2015. The current usage metrics is available 48-96 hours after online publication and is updated daily on week days.
Initial download of the metrics may take a while.