Fig. 1
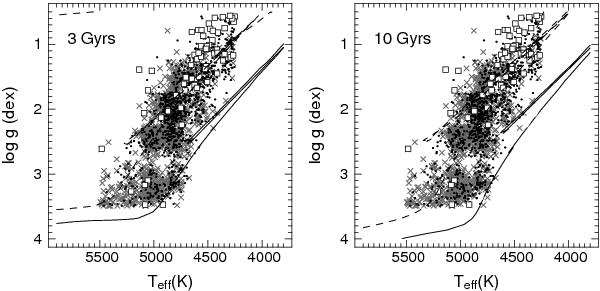
log g versus Teff values for the SN75 RAVE sample (see text) with overplotted isochrones of 3 Gyr (left panel) and 10 Gyr (right panel) with metallicities [M/H] = 0.0 dex (solid lines) and [M/H] = −1.0 dex (dashed lines). Black points, grey crosses, and open squares represent the thin disc, dissipative, and accretion components as defined in Sect. 4.
Current usage metrics show cumulative count of Article Views (full-text article views including HTML views, PDF and ePub downloads, according to the available data) and Abstracts Views on Vision4Press platform.
Data correspond to usage on the plateform after 2015. The current usage metrics is available 48-96 hours after online publication and is updated daily on week days.
Initial download of the metrics may take a while.